The detective's workflow
O que você vai aprender
- to fold the chapter's instruments into one workflow of five steps
- to find the node where the time burns — allowing for
loopsand for the children's time - to tell "the planner went blind" from "the route is honest but expensive"
- to make a full diagnosis of the report from the first lesson — and to understand why it is too early to fix it
The last watch of the first chapter
Six hundred hours station time. A few watches ago, at this very hour, the morning report hung — and QUERY opened the hatch to the lower decks for you for the first time. Since then you have learned the language of blueprints: cost and rows, actual time and loops, pages and Rows Removed, the estimate against the fact.
There will be no new instruments today. Today is about the order in which an engineer reaches for them.
QUERY: Any cadet poking about at random will find something suspicious in a plan by the fifth attempt. An engineer always looks in the same order — and therefore finds it on the first.
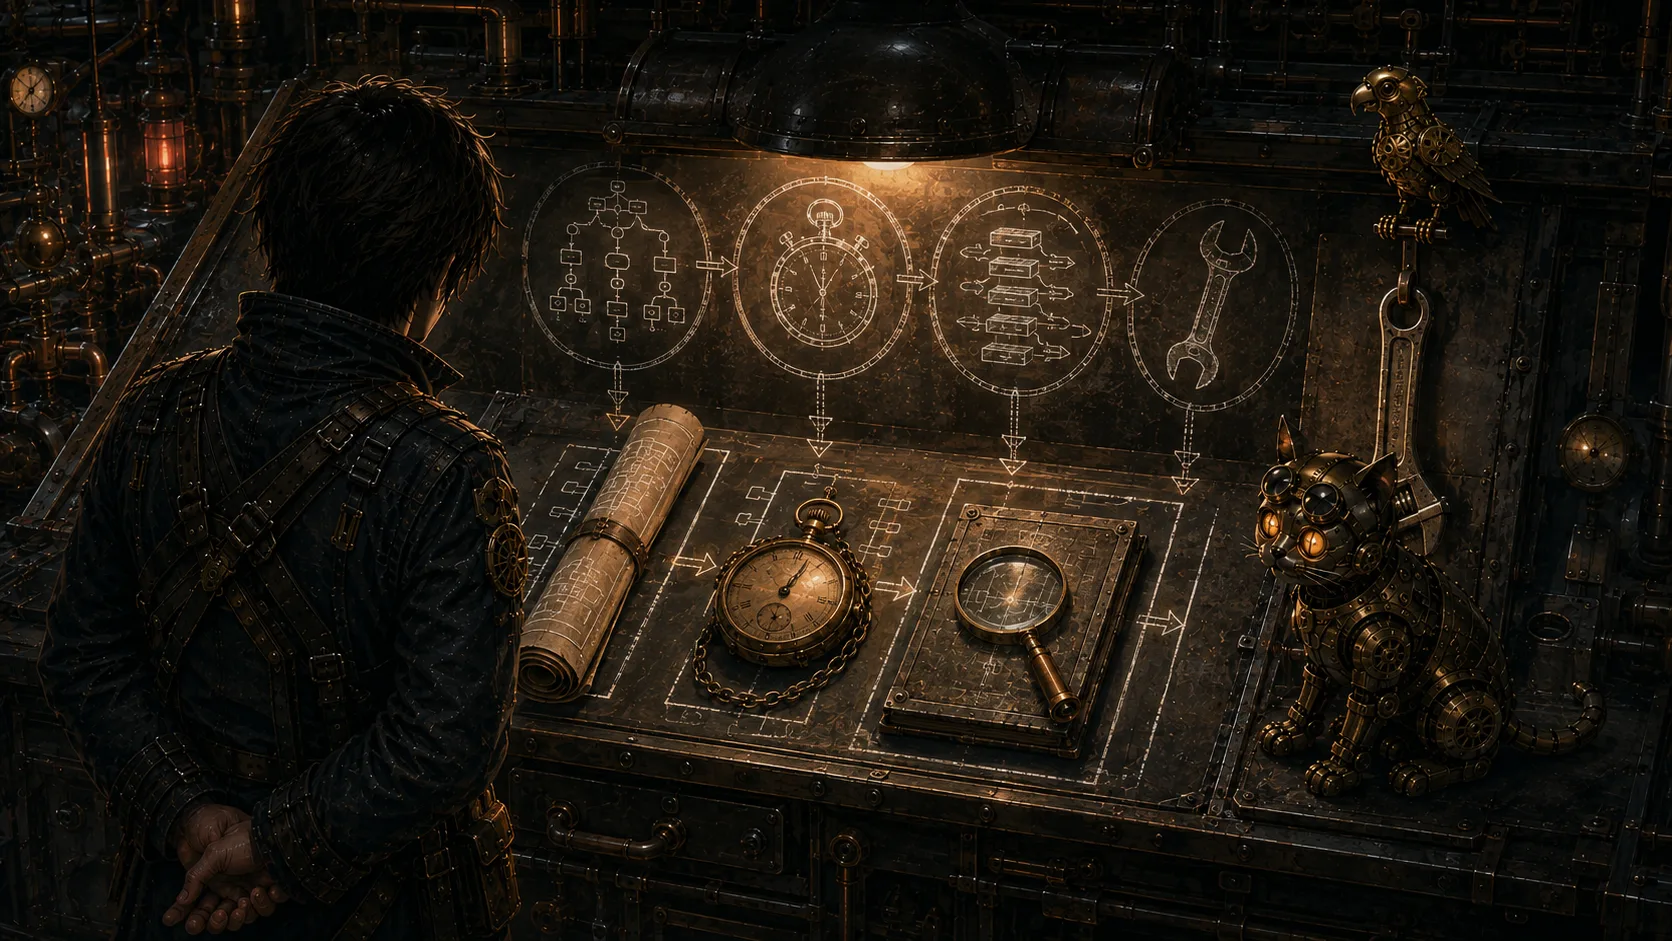
The detective's five steps
When a query hangs, an engineer does not "look at the plan" — an engineer walks the plan along a route, always the same one.
Step 1. Take the full blueprint: EXPLAIN (ANALYZE, BUFFERS). One run and every piece of evidence is in your hands: the route, the real time, the rows, the pages. For a SELECT this is safe (about under ANALYZE you remember from Vault-9: it executes for real).
Step 2. Find the node where the time burns. Not the lowest one and not the most frightening-looking, but the node with the greatest own time: multiply its actual time by loops — the trick from the lesson on timing — and subtract the children's time: a parent's time always includes theirs. Usually nine tenths of a run burns in one or two nodes.
Step 3. Check the estimate against the fact — est and actual — in that node. Est is that same rows from the first bracket, the navigator's forecast; actual is the fact from the second. A discrepancy of an order of magnitude means the planner has gone blind: the route was built from wrong charts, and it is the charts that need treating, not the road. If the estimate matched, the navigator saw everything and chose this route anyway: there was nothing cheaper by its model, and it is the road itself you have to think about.
Step 4. Look at what was read for nothing: Rows Removed and Buffers. How many rows the node threw away the moment it read them, and how many pages it lifted for the sake of a handful of useful ones. This is the translation of the complaint "slow" into the language of concrete evidence.
Step 5. Only now think about fixing it. An index, a rewritten query, redrawn charts — the treatment is chosen from the diagnosis of steps 2 to 4. Notice where this step stands: last. Any fixing before this step is not fixing but guesswork.
Case #1: the report that hung
Let us apply the workflow to the case the chapter began with. In the first lesson you looked at this query through a plain — a blueprint with no run — and found a suspicious SubPlan with a full pass over the log in the tree. That was a suspicion. Now gather the evidence.
Step one is to take the full blueprint. Run it and do not be surprised that the cell thinks for longer than usual: this time the query really is executed, all two hundred passes over the log.
SubPlan 1 in the tree, and Seq Scan on ls_readings inside it: its loops, Rows Removed by Filter and Buffers are the chief evidence in this case.Steps 2 to 5: the diagnosis
Step 2 — where it burns. At the top is an Index Scan on the sensors' (that is how the navigator hands rows out in ORDER BY order straight away, so no Sort node was even needed). Its time is huge, but almost all of it is its children's time. Whereas Seq Scan on ls_readings inside the SubPlan: a few milliseconds per pass — a trifle, until you multiply it by loops=200. Two hundred passes eat nearly the whole run. Its own time is the greatest in the tree: the node is found.
Step 3 — est against actual. In the burning node the estimate is rows=450 and the fact is rows=539 on average per pass. The discrepancy is not even a factor of one and a half — nothing like an order of magnitude. The planner has not gone blind: the charts are fresh and the route was honestly built from them. Fixing the statistics would be pointless — the route is expensive in itself.
Step 4 — what was read for nothing. Rows Removed by Filter: 179461 — every pass throws away a hundred and seventy-nine thousand rows of the log for the sake of ~539 useful ones. And Buffers: shared hit=302600 — that same bundle of 1513 pages you counted in the lesson on BUFFERS, read two hundred times over. (JIT lines have appeared at the bottom of the plan — on expensive routes the machine compiles parts of the plan on the fly; they do not matter for our diagnosis.)
Step 5 — the fix? The diagnosis is ready: the query rereads the whole log two hundred times, because the is correlated and the machine has nothing with which to read the log in a pinpoint way. There are at least two cures — rewrite the query so that the log is read once, or give the navigator a short road to one sensor's readings. You will master both in the chapters to come — today we still created not a single index, and that is right. For the first time you have not a complaint that it is "slow" but a case with evidence.
At the hatch
You and QUERY come up from the lower decks. The hum of the machine behind you sounds different now — not noise but a speech you have begun to make out.
QUERY: A good watch. You read the plan the way an engineer reads it: step by step, with no guessing. You know, in Kotomarket's log of plans I once came across a strange index that… Never mind. An old tab. Take it that I was dozing.
It falls silent mid-sentence and changes the subject too quickly; the tail of its process freezes for an instant. You do not ask again. Not yet.
The report is still not fixed — and that is right: a diagnosis with no treatment is better than treatment with no diagnosis. From the next chapter the craft itself begins: what routes through data there are at all, and why the navigator picks one rather than another.